Skip to content

Data Visualizations

performance comparison of 4 types of long term investment strategy - Cover

Why Does Focus Investing Performs Better than Market-Cap ETF than High-Dividend ETF than Bond ETF | 10-Year Empirical Study | Long-term Investing

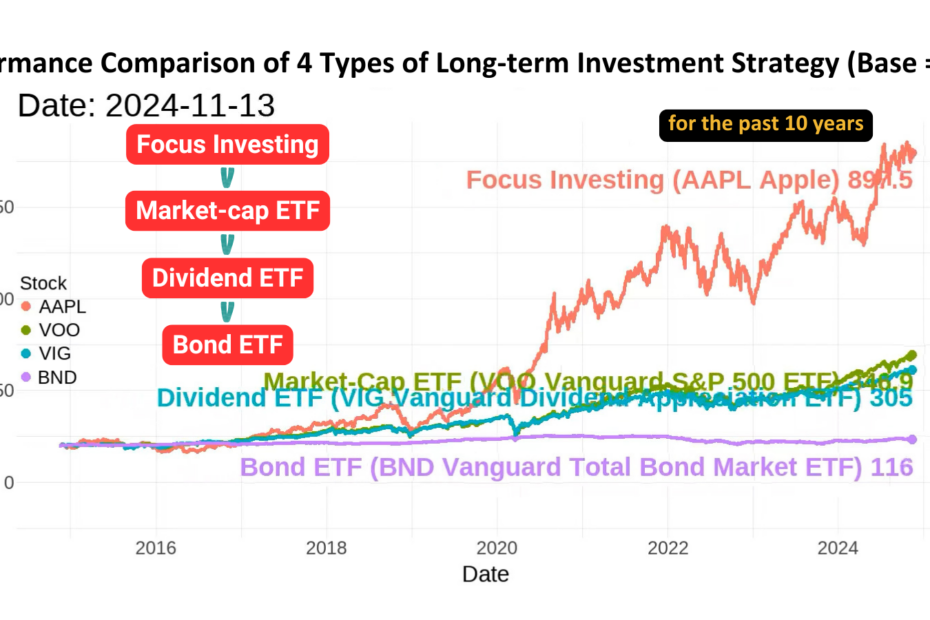
Excluding short-term speculation akin to gambling, our study today focuses on a 10-year long-term investment perspective. We found that individual stock investments (focus investing) outperform market-cap ETFs, market-cap ETFs outperform high-dividend ETFs, and high-dividend ETFs outperform bond ETFs.

Assuming an investor allocated $100,000 to each of these four strategies 10 years ago:
– focus investing (represented by Apple, AAPL) grew to $884,000.
– Market-cap ETF (represented by Vanguard S&P 500 ETF, VOO) grew to $342,000.
– High-dividend ETF (represented by Vanguard Dividend Appreciation ETF, VIG) grew to $302,000.
– Bond ETF (represented by Vanguard Total Bond Market ETF, BND) grew to $116,000.

How can investors choose a strategy that aligns with their risk tolerance and personality, allowing them to achieve the best returns while still enjoying peace of mind?

In the following sections, we’ll explore each strategy in detail, analyzing their strengths and weaknesses to help you make an informed choice.

TSMC and Intel Net Income Comparison 2024Q2

TSMC and Intel Net Income Comparison 2001 Q1 to 2024 Q2 | TSMC (Net Income 8.2 billion) dominates Intel (Net Income – 1.6 billion) in the semiconductor foundry market.

We compared the quarterly net profits of the two leading semiconductor foundries in the world, TSMC and Intel, covering the period from the first quarter of 2001 to the second quarter of 2024. It can be seen that for most of the time before 2020, Intel’s net profit was greater than TSMC’s. However, starting in the second quarter of 2022, TSMC’s net profit surpassed Intel’s, thanks to its technological advantage in semiconductor foundry services. Over the past two years, Intel has even experienced losses in the first two quarters of 2024, while TSMC has consistently maintained profitability every quarter for more than 23 years, which is quite impressive. We also analyzed the significance behind this shift in profitability, including Intel’s decision in 2021 to re-enter the foundry market and the competition and challenges it has faced since then.

Comparison of Gross Profit Margins of Major Car Manufacturers - cover

Comparison of Gross Profit Margins of Major Automobile Manufacturers | Recent Overview of the Automobile and Electric Vehicle Industry

The figure compared the gross profit margins of major international automobile manufacturers over a period spanning from the second quarter of 2022 to the fourth quarter of 2023, totaling seven quarters. In the fourth quarter of 2023, the gross profit margins of each car manufacturer from highest to lowest were Toyota at 22.3%, Honda at 21.7%, Tesla at 17.6%, General Motors at 7.7%, Ford at 5.5%, and the startup Rivian at -46%.

Surprisingly, Rivian had a staggering gross profit margin of negative 193% in the second quarter of 2022, likely due to insufficient production capacity, possibly inadequate yield rates, and insufficient sales. However, fixed costs such as management expenses continued to be incurred, demonstrating the significant challenges faced by capital-intensive startup companies. Since its inception, the company has yet to turn a profit for any quarter. Nonetheless, its electric pickup truck performance and camping experience are remarkable, and there is hope for Rivian to perform well in the future.