Table of Contents
- 1 Comparison of Gross Profit Margins of Major Automobile Manufacturers
- 2 Recent Overview of the Automotive and Electric Vehicle Industry
- 3 Financial Statement Analysis – Gross Profit Margins
- 4 Development of the Electric Vehicle Industry Chain in Mexico
- 5 Tesla Faces Challenges in Sales and Labor Costs
- 6 Impact of China’s Green Energy Subsidy Policies on the World
- 7 Related Articles
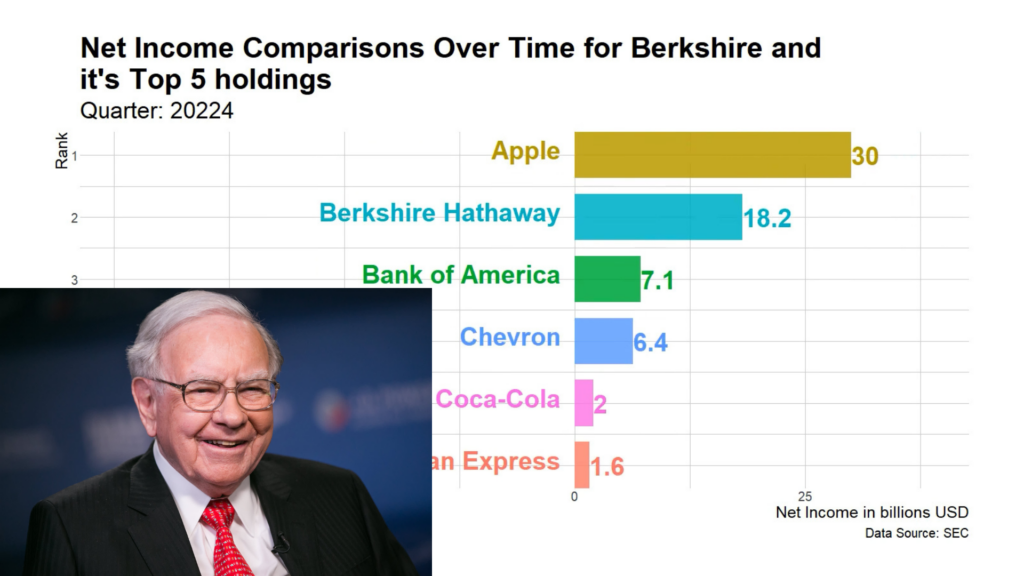
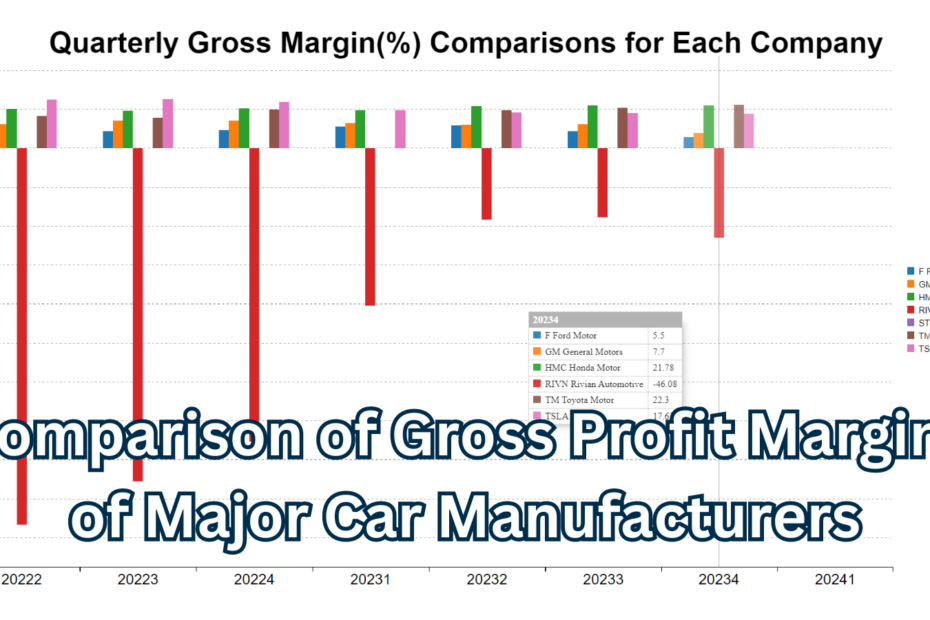
Comparison of Gross Profit Margins of Major Automobile Manufacturers
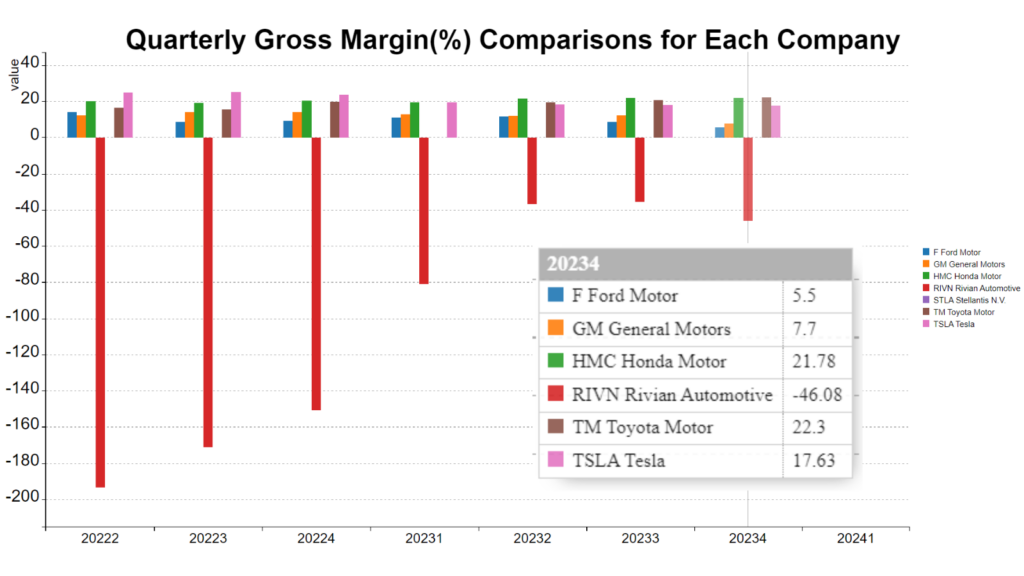
The figure compared the gross profit margins of major international automobile manufacturers over a period spanning from the second quarter of 2022 to the fourth quarter of 2023, totaling seven quarters. In the fourth quarter of 2023, the gross profit margins of each car manufacturer from highest to lowest were Toyota at 22.3%, Honda at 21.7%, Tesla at 17.6%, General Motors at 7.7%, Ford at 5.5%, and the startup Rivian at -46%.
Surprisingly, Rivian had a staggering gross profit margin of negative 193% in the second quarter of 2022, likely due to insufficient production capacity, possibly inadequate yield rates, and insufficient sales. However, fixed costs such as management expenses continued to be incurred, demonstrating the significant challenges faced by capital-intensive startup companies. Since its inception, the company has yet to turn a profit for any quarter. Nonetheless, its electric pickup truck performance and camping experience are remarkable, and there is hope for Rivian to perform well in the future.
Recent Overview of the Automotive and Electric Vehicle Industry
BYD Introduces New Models
Chinese electric vehicle manufacturer BYD unveiled three high-end models on April 16, 2024. All three new vehicles are part of BYD’s Dynasty Leopard brand series, including the flagship SUV Leopard 8, as well as two concept vehicles, the SUV Super 3 and the sports car Super 9, which will be revealed at the Beijing Auto Show on April 25.
BYD’s Product Line Strategy
BYD’s automotive product line strategy can be summarized as follows:
- Multi-brand, multi-model strategy: BYD owns passenger car brands BYD and BYD Commercial Vehicles, high-end brand Tang Dynasty, and ride-hailing brand E Road (online reservation rental cars), covering sedan, SUV, MPV, commercial vehicles, and other models.
- New energy vehicles as the focus, with traditional fuel vehicles as supplements: BYD is one of the global leaders in new energy vehicles, possessing core technological advantages in this field. BYD focuses on the development of new energy vehicles while also maintaining a certain product line of traditional fuel vehicles.
- Price coverage across the spectrum: BYD’s automotive product prices range from below 100,000 RMB to over 500,000 RMB, meeting the needs of different consumers.
Specifically, BYD’s automotive product line can be divided into several series:
- Dynasty Series: The Dynasty series is BYD’s flagship passenger car series, covering sedan, SUV, MPV, and other models, with prices mainly ranging from 100,000 RMB to 300,000 RMB. Dynasty series models mainly use BYD’s e-platform 3.0 technology, equipped with blade batteries, featuring long range, high safety, and other advantages.
- Ocean Series: The Ocean series is BYD’s youthful passenger car series, primarily composed of sedans and SUVs, with prices mainly ranging from 100,000 RMB to 200,000 RMB. Ocean series models mainly use BYD’s e-platform 2.0 technology, featuring stylish design, rich configurations, and other advantages.
- Tang Dynasty Series: The Tang Dynasty series is BYD’s high-end passenger car series, mainly consisting of sedans and SUVs, with prices mainly above 300,000 RMB. Tang Dynasty series models mainly use technology jointly developed by BYD and Daimler, featuring strong performance, luxurious configurations, and other advantages.
- Commercial Vehicles: BYD’s commercial vehicle product line covers trucks, buses, and special vehicles, making it one of the leaders in China’s commercial vehicle market. BYD’s commercial vehicles mainly use hybrid and pure electric technologies, featuring energy saving, environmental protection, reliability, and durability.
BYD’s automotive product line strategy has achieved good results. In 2023, BYD’s car sales exceeded 3 million units, with 1.6 million pure electric vehicles and 1.4 million hybrid vehicles, with the main market still in mainland China.
Here are some specific examples of BYD’s automotive product lines:
- Dynasty Series: Han, Song, Qin, Tang, Yuan, Dolphin, Destroyer, etc.
- Ocean Series: Heide, Haitao, Haishang, Haixing, etc.
- Tang Dynasty Series: Tang D9, Tang X
- Commercial Vehicles: Song MAX, Tang DM, Yuan PLUS, Han DM, Qin PLUS, etc.
BYD’s automotive product line strategy has the following advantages:
- Meeting the needs of different consumers: BYD’s multi-brand, multi-model strategy can meet the needs of different consumers, thereby increasing market share.
- Occupying a leading advantage in the field of new energy vehicles: BYD regards new energy vehicles as the focus of its product line development and has core technological advantages in this field, which will give it a favorable position in future competition.
- High quality comopared to cost: BYD’s automotive product prices cover the entire spectrum, with high cost performance, making it highly competitive in the Chinese automotive market.
Of course, BYD’s automotive product line strategy also has some shortcomings, such as:
- Lower brand awareness: BYD’s brand awareness is relatively low in overseas markets, which may pose challenges to its expansion in overseas markets. Currently, there are no BYD electric vehicles sold in Taiwan.
- Overly bloated product line: BYD’s product line is overly bloated, which may lead to problems such as unclear product positioning and resource dispersion.
Overall, BYD’s automotive product line strategy is successful, but there is still room for improvement. In the future, BYD should continue to strengthen brand building, enhance the international competitiveness of its products, and adjust its product line layout appropriately to increase market competitiveness.
Financial Statement Analysis – Gross Profit Margins

Gross profit margin refers to the ratio of profit obtained by a company from selling goods or providing services over a period of time, after deducting direct costs, to the revenue generated. It is an important indicator of a company’s profitability and can be used to assess its operational and financial status.
The formula for calculating gross profit margin is gross profit divided by sales revenue, where gross profit equals sales revenue minus direct costs. Direct costs refer to the expenses incurred by a company in the production or provision of goods or services, such as raw material costs, labor costs, packaging costs, etc.
A higher gross profit margin indicates stronger profitability for a company. Companies with high gross profit margins typically have higher competitiveness and can sell goods or services at higher prices. Additionally, companies with high gross profit margins usually have stronger financial capabilities to withstand economic fluctuations and competitive pressures.
In financial analysis and value investing, gross profit margin is one of the important indicators. Investors can analyze gross profit margin to understand a company’s profitability and financial strength. Companies with high gross profit margins usually have higher investment value and are more likely to sustain profitability in the long term. For example, a company may possess technologies that its competitors lack in its industry, protected by patents and management expertise. With this high value-added advantage, the company naturally achieves a higher gross profit margin, allowing it to sell products or services at higher prices, and even retain market share in the event of price increases.
There is a close relationship between gross profit margin and comparative competitive advantage. The higher the gross profit margin, the stronger the company’s comparative competitive advantage. This is mainly because companies with high gross profit margins can sell goods or services at higher prices, thus earning more profit. For example, Apple has a strong brand and technological advantage, allowing it to sell products like the iPhone at higher prices. Therefore, Apple’s gross profit margin has consistently remained at a high level, around 40%.
While a high gross profit margin is an important component of comparative competitive advantage, it is not the only factor. Companies also need to have other advantages such as innovation, management, and marketing capabilities to maintain a competitive edge in the long run.
Welcome to Sunfortzone, our goal is to help value investors understand more about their investments and become a better person.
If you want to grow on the path of value investing, please subscribe to our Youtube channel to get more valuable contents in the future.
Wall streets make money on activities, we, as value investors, make money on inactivities.
Development of the Electric Vehicle Industry Chain in Mexico
Under pressure from the United States, the federal government of Mexico has rejected providing incentives such as cheap public land or tax breaks for investment in electric vehicle production, and has kept its distance from Chinese automakers. Currently, there are about 20 Chinese automakers selling cars in Mexico, but none of them have established factories in Mexico. Chinese cars account for about one-third of all car brands in Mexico. The U.S. intervention reflects growing concerns from the U.S. automotive industry, unions, and politicians that Chinese automakers such as BYD, SAIC, Geely, Chery, and JAC intend to use Mexico as a backdoor to sell cheap electric vehicles in the United States without having to pay the current high tariffs of up to 27.5%.
Tesla Faces Challenges in Sales and Labor Costs
Electric car manufacturer Tesla announced on April 18th that the company had laid off 300 temporary workers in Germany according to contract terms. The company is actively working to reduce its global workforce by 10%.
Tesla’s revenue for the first quarter of 2024 was $21.3 billion dollars, down 9% from the same period last year, mainly due to various factors including decreased delivery volume, increased costs, and a stronger U.S. dollar. Due to these factors and a decline in gross profit margin, net profit decreased by 55% compared to the first quarter of 2023, dropping to $1.13 billion. Diluted earnings per share also decreased by 34% compared to the first quarter of 2023 due to the decline in net profit.
Tesla’s free cash flow for the first quarter of 2024 was negative $2.5 billion. This was mainly due to an increase in inventory caused by a disparity between production volume and new car deliveries, as well as an increase in capital expenditure. In the first quarter of 2024, Tesla delivered 386,810 vehicles, down 8.5% from the first quarter of 2023. Reasons for the decrease in delivery volume include weak sales, intensified competition among electric vehicle manufacturers, and price competition among manufacturers forcing Tesla to lower prices to sell.
Without new sources of growth, the company’s prospects are likely bleak, so we suggest that Musk should not abandon the launch of the low-cost electric vehicle “Model 2.” This model could accelerate Tesla’s operational growth, and if this project continues to be delayed, Tesla may enter another sales hell.
On the other hand, Tesla’s energy storage business is growing rapidly, with the company expecting energy storage deployments to increase by at least 75% in 2024.
Overall, Tesla’s financial performance for the first quarter of 2024 was disappointing, with the company failing to deliver good results in revenue and EPS, highlighting that no one can truly dominate the entire automotive market. This industry requires high capital expenditure, and cars are not necessarily selling. However, there are still some bright spots, such as the growth of the energy storage business. Tesla remains a growth company in the long run, but the company is facing some short-term challenges.
Impact of China’s Green Energy Subsidy Policies on the World
The latest research from a German institution indicates that almost all Chinese companies can receive subsidies from the Chinese government as long as they are involved in the field of green energy, posing a serious challenge to related European companies. Previous reports have pointed out that in addition to electric vehicles, the European Union will also conduct anti-subsidy investigations on Chinese wind power equipment suppliers.
Thanks for spending your valuable time with us! If you like our content, please like and subscribe to our Youtube channel to get more valuable content.
Furthermore, please visit our website sunfortzone.com for more data-driven insights, and join our Discord Server to discuss with other investors.
If you’ve learned something from our productions, please check out the Interactive Brokers webpage and click the inclusive link down below to open an account for free. Your actions means a world to us!

When you open an account through the referral link above, you will receive 1 IBKR stock worth $1 USD for every $100 deposited, with a maximum value of $1,000 in IBKR stocks.
What’s your idea? please leave a comment below! We would like to learn something from you as well!
Related Articles

Warren Buffett shares how they choose businesses to invest in and the philosophy behind it.

5 Key Takeaways from The Intelligent Investor by Benjamin Graham